Art Network
2018–2019

The network of the global art scene
The Art Network | video commentary by Albert-László Barabási
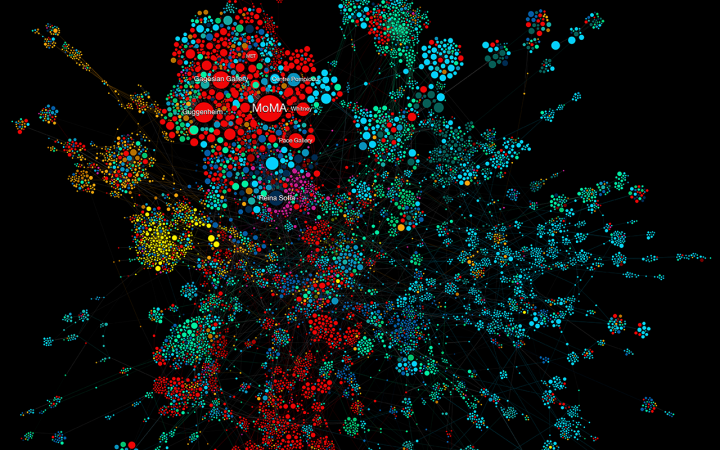
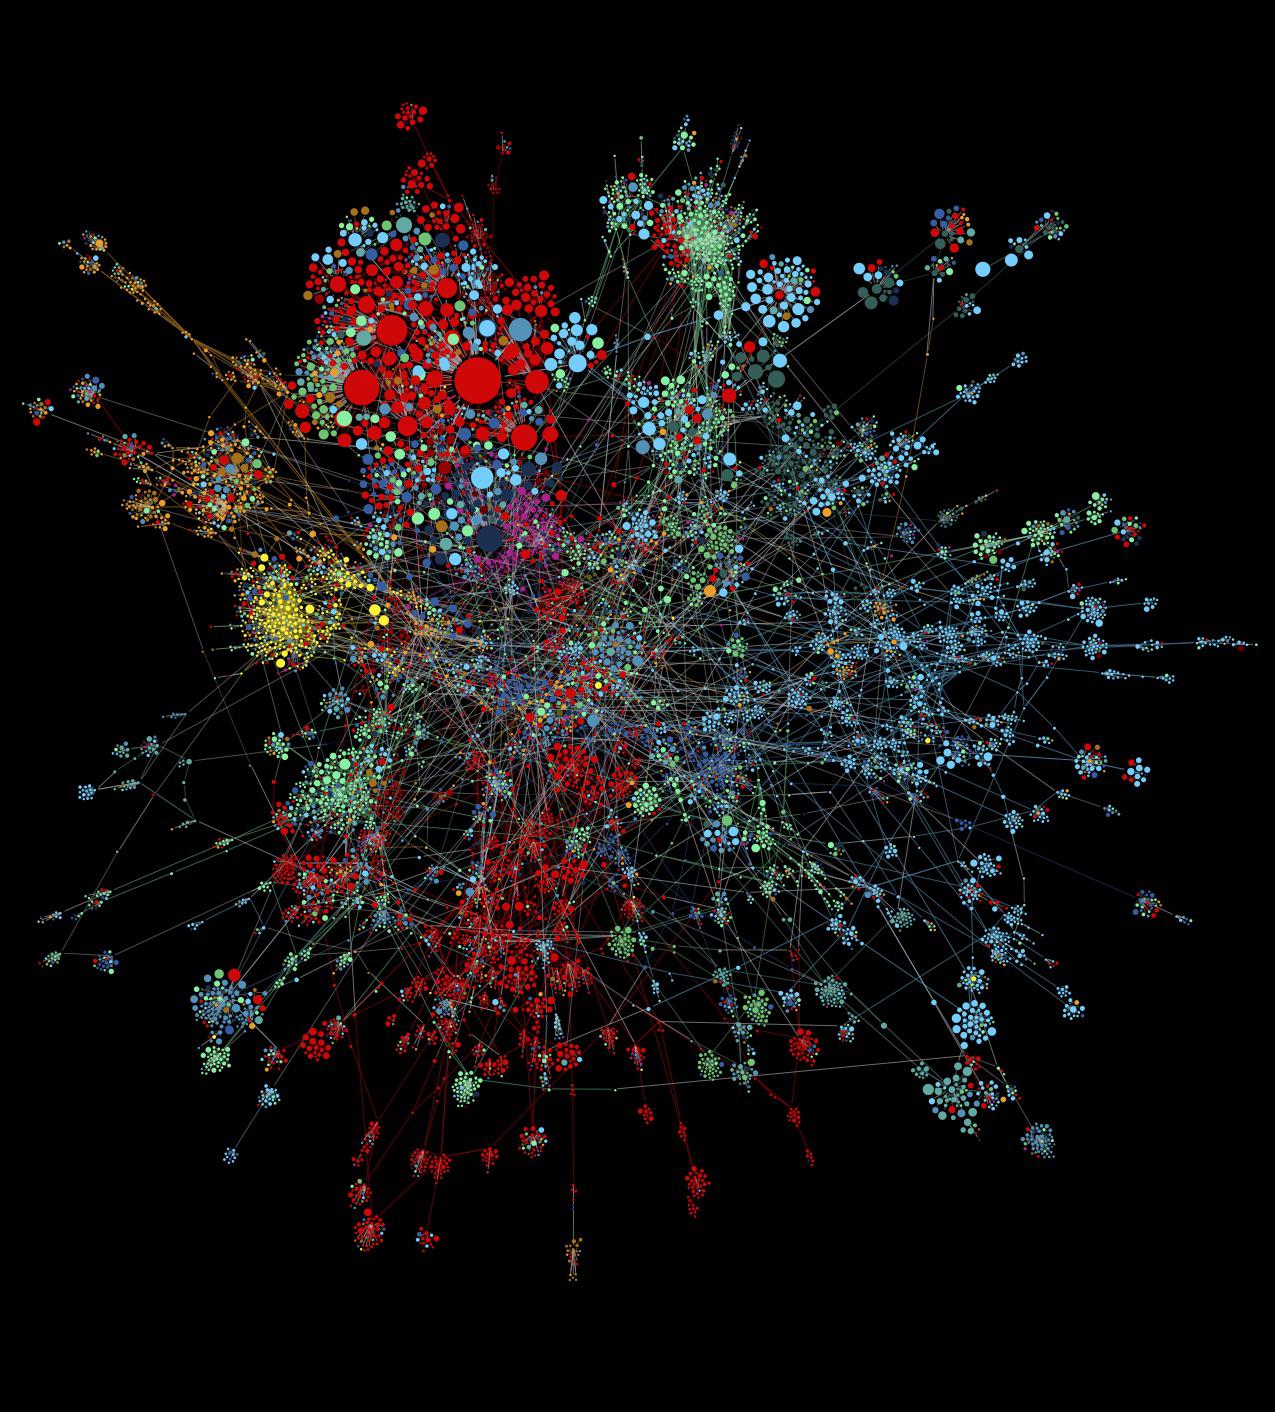
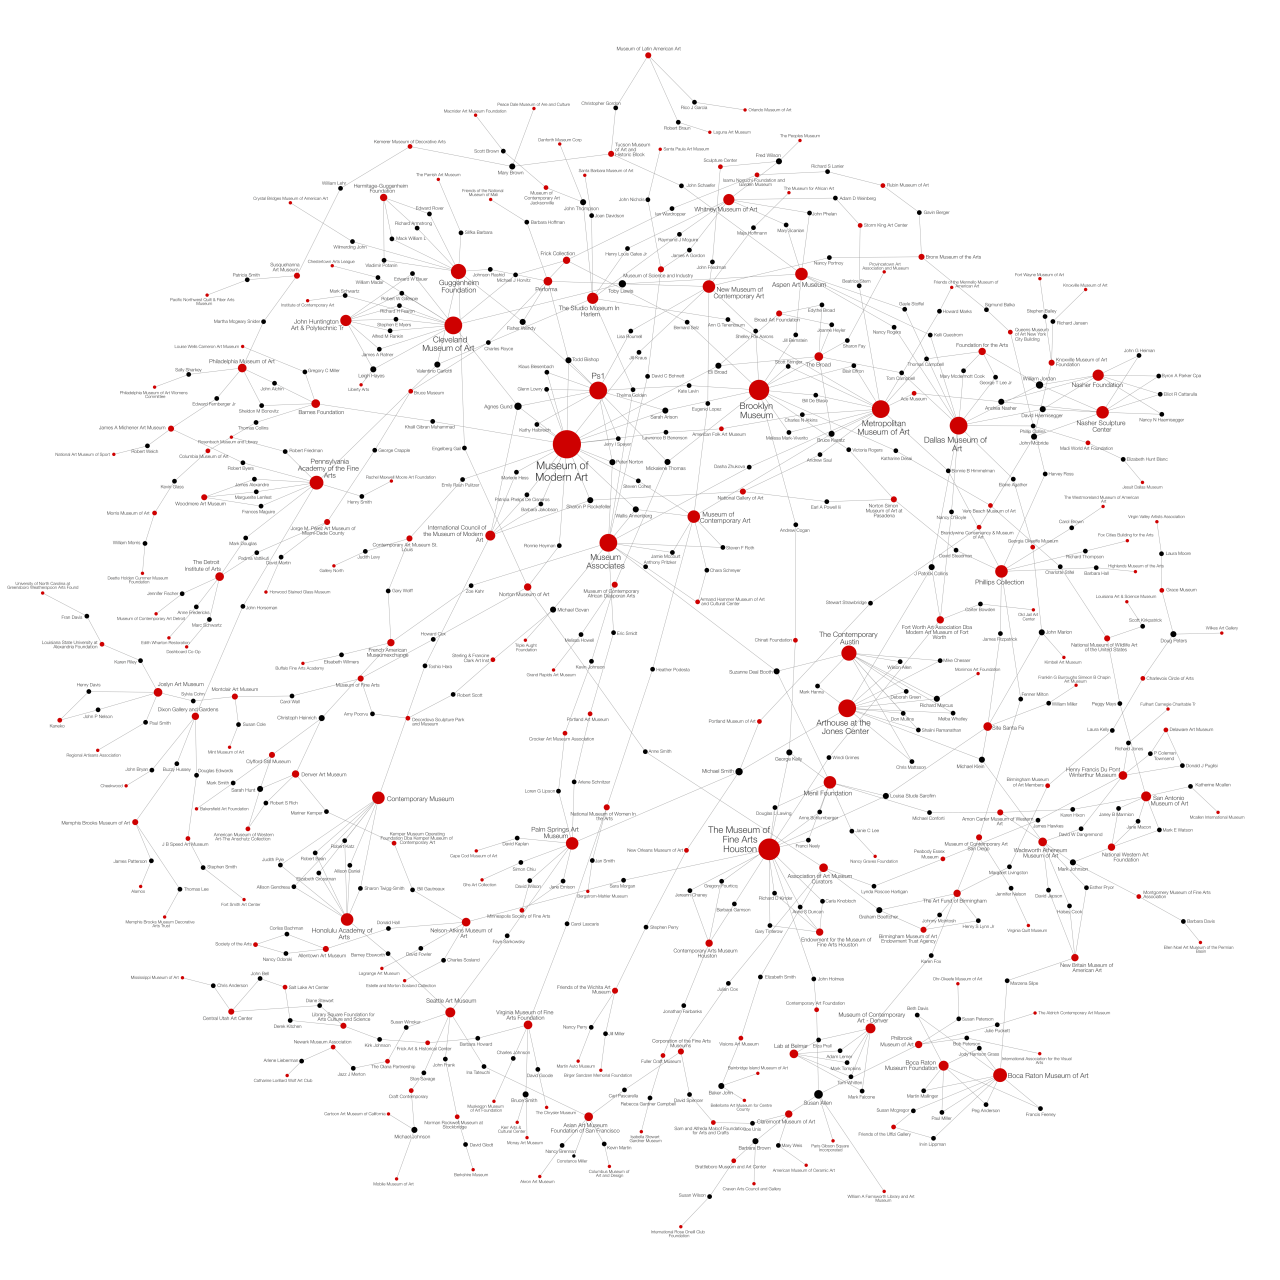
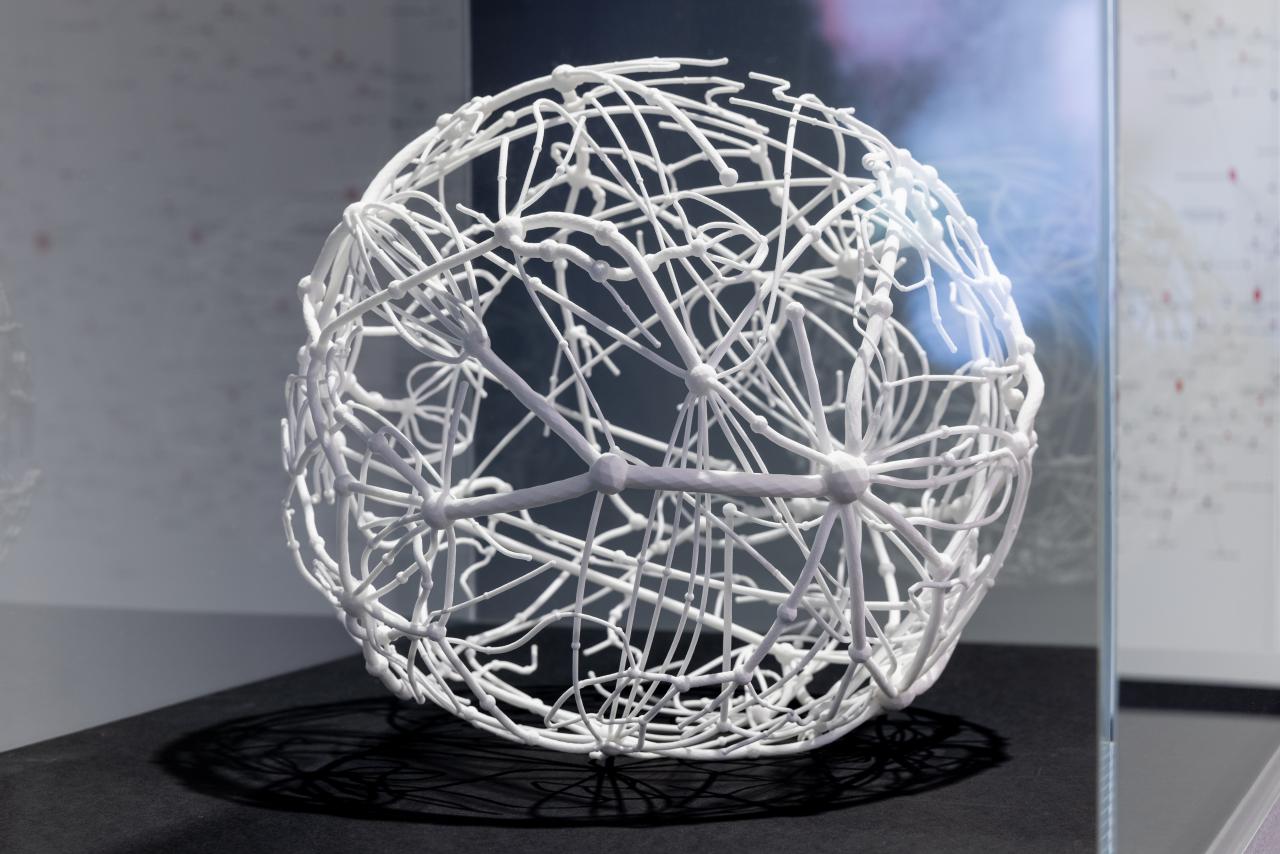
In 2016, the BarabásiLab began applying the tools of network and data science to the art world. A massive number of data points about the exhibition history of half a million artists in galleries and museums worldwide enabled the Lab to unveil the invisible connections behind institutions, and the impact of this network on artists’ careers. In »The Art Network«, two institutions—a museum and a gallery, for example—are connected if an artist has shown their work in both institutions. The map captures the largely invisible network between thousands of art institutions. »The Art Board Network« shows the interconnectivity between institutions based on their governance. The BarabásiLab used the tax data filed by all art institutions in the US to identify the respective boards of directors. The network’s nodes are museums and art-related nonprofit organizations, connected if they share a board member.


